
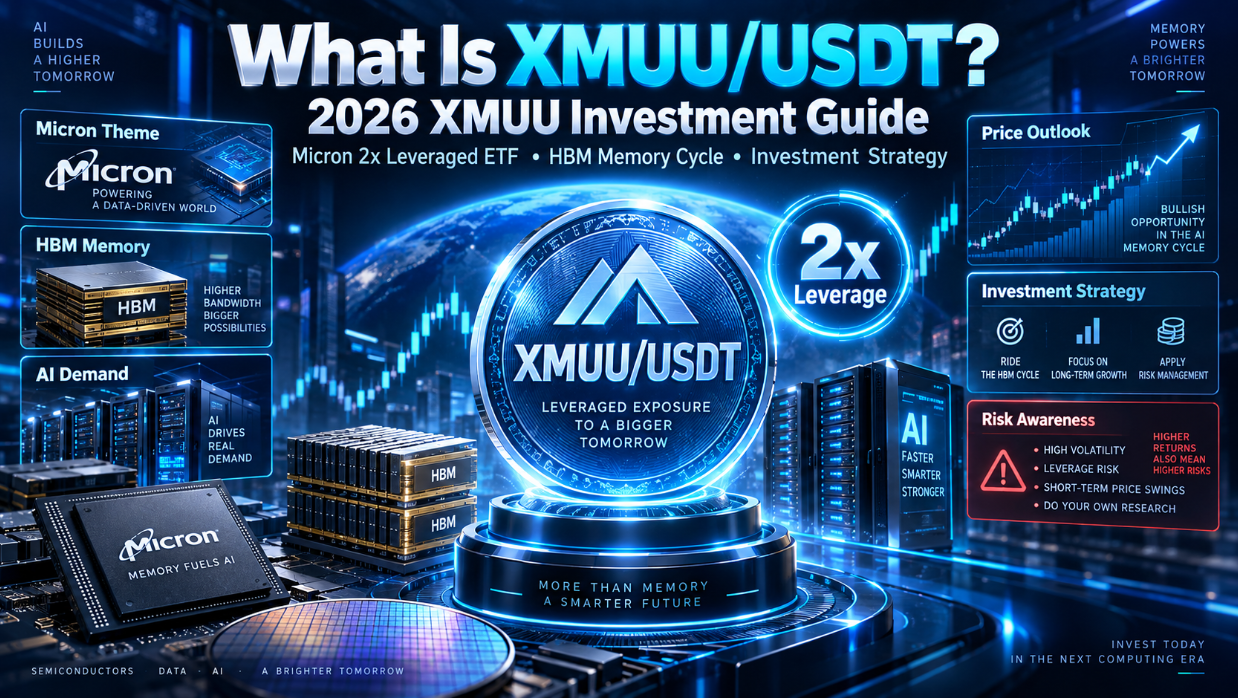
XMUU/USDT is an on-chain asset tied to a Micron-focused daily 2x ETF listed on HIBT. It ultimately corresponds to the Direxion Daily MU Bull 2X ETF (MUU), and MUU seeks 200% of the daily price move of Micron Technology (NASDAQ: MU) common stock—not a fixed 2x of Micron’s long-term cumulative return.
In 2026, Micron is in an extremely strong AI Memory boom. The company’s FY2026 third-quarter revenue reached $41.456 billion, GAAP gross margin was 84.6%, operating cash flow was $25.39 billion, and it guided for fourth-quarter revenue of $50 billion and a gross margin of about 86%. HBM4 has entered high-volume shipments, and multi-year Strategic Customer Agreements have also improved visibility into future demand.
But for XMUU investors, “Micron’s long-term direction is right” is only step one. Daily resetting means the final result also depends on the sequence of MU’s daily gains and losses. High volatility, a memory-cycle reversal, fund fees, and price divergence between XMUU and MUU can all make actual returns completely different from the intuition of “MU’s gain times two.”
Users can view the latest price, volume, and order book through XMUU live market data. Before trading, you should also open all three markets—MU, MUU, and XMUU—and calculate price deviations using identical timestamps.
Risk disclosure: This article was updated on September 15, 2026, and is for information organization and investment research only. It is not investment advice, a return promise, or a trading recommendation. Daily leveraged single-stock ETFs are high-risk instruments, and XMUU adds Solana on-chain, product issuance, custody, liquidity, premium/discount, platform, and regulatory risks.
Key Takeaways: 7 Things to Know Before Trading XMUU
- XMUU ultimately corresponds to MUU, and MUU’s underlying security is Micron stock, MU.
- MUU seeks 200% of MU’s daily return, not a fixed 2x over a week, month, or year.
- Micron is currently in an unusually strong AI Memory cycle, with revenue, gross margin, and cash flow all growing significantly.
- HBM4 is already in actual high-volume shipments; it is no longer just a future product roadmap.
- Multi-year SCAs may improve demand and price visibility, but they do not completely eliminate the Memory Cycle.
- High MU volatility creates path dependency through daily reset, so even a correct direction can produce lower-than-expected returns.
- Versus the U.S. MUU ETF, XMUU adds Solana, market-making depth, and premium/discount risks.
1. What Is XMUU/USDT? First, Understand the Four-Layer Asset Relationship
XMUU is not a cryptocurrency issued by Micron, nor is it a Micron points token or governance token. Its value chain has four layers:
The first layer is Micron Technology, whose NASDAQ ticker is MU. MU’s price is driven by memory prices, HBM demand, corporate earnings, cash flow, competition, and equity valuation.
The second layer is the Direxion Daily MU Bull 2X ETF, ticker MUU. It seeks to deliver 200% of the daily percentage change in MU before fees.
The third layer is the XMUU asset on Solana. The contract address given in HIBT’s announcement is:
XsjZG9MgLMECjzSSxq3G7rabDceoaDqhN4C4zwce4i8
The fourth layer is HIBT’s XMUU/USDT trading market, with USDT as the quote asset.
The full transmission chain is:
Micron fundamentals → MU share price → MUU daily 2x target → XMUU on-chain and market price
Any tracking error, insufficient liquidity, or product-rule change at any layer can affect the final return.
2. When Did HIBT List XMUU? What Are the Network and Contract?
The HIBT official announcement shows:
- Trading pair: XMUU/USDT;
- Network marked as SOL;
- Deposits are open;
- Trading opened on September 14, 2026, at 04:00 UTC, which is 12:00 UTC+8;
- Withdrawals opened on September 15, 2026, at 04:00 UTC;
- The block explorer points to the Solana contract above.
The announcement confirms the trading and on-chain identifier, but the public page does not fully explain who issues XMUU, who custodies the underlying MUU shares, how minting/redemption works, whether investors have direct redemption rights, or how corporate actions are handled.
Therefore, you cannot infer that XMUU is equivalent to directly holding U.S. ETF shares merely because it “corresponds to MUU.” A listing platform also does not mean Micron or Direxion provides official endorsement for XMUU.
3. What Exactly Is MUU? Why Is It Not “Two Shares of Micron”?
The Direxion MUU official page states that MUU seeks 200% of the daily performance of MU common stock, with a daily target of +200%. Direxion also explicitly warns that investing in MUU is not the same as investing directly in MU.
MUU builds roughly 2x daily exposure through swaps, derivatives, and cash-like instruments; it is not simply a long-term holding of two shares of Micron stock. This creates:
- Swap counterparty risk;
- Daily rebalancing costs;
- Financing costs;
- Expense ratio impact;
- Tracking error;
- ETF market price versus NAV deviation;
- Single-stock concentration risk.
As of September 11, 2026, Direxion showed MUU’s gross/net expense ratio at about 1.01%. The fee may look small, but long-term holders must also consider frictions such as swap financing and frequent rebalancing.
4. If Micron Rises 20%, Why Won’t XMUU Necessarily Rise 40%?
If MU rises 20% in one trading day, MUU’s target return before fees is about 40%. But if MU rises 20% cumulatively over a month, you cannot directly conclude that MUU will rise 40% over the same period.
The reason is that leverage is recalculated every day. Today’s return changes the principal base used to calculate tomorrow’s gain or loss, so the final result depends on each day’s price path.
The correct expression is:
2× Daily Return ≠ 2× Long-Term Return
XMUU must then pass through another layer of on-chain and marketplace pricing, so actual results may be further affected by premiums, discounts, the USDT price, and liquidity.
5. Understand Daily Reset Completely With a $100 Example
Case 1: Up 10%, Then Down 10%
Assume MU starts at $100.
Day one: up 10%, to $110. Day two: down 10%, to $99. Cumulative return: -1%.
MUU theoretically rises 20% on day one, turning $100 into $120. On day two it falls 20%, turning $120 into $96. Cumulative return: -4%.
If you simply multiply MU’s -1% by two, you get -2%; the actual path result is -4%.
Case 2: Up 5% Two Days in a Row
MU starts at $100, rises 5% on two consecutive days, and ends at $110.25, a cumulative gain of 10.25%.
MUU theoretically rises 10% on each of the two days, ending at $121, a cumulative gain of 21%, slightly higher than the 20.5% obtained by multiplying 10.25% by two.
This shows that compounding is not always negative. Consecutive same-direction trends can produce positive compounding; repeated choppiness is more likely to cause volatility drag.
6. What Is Volatility Decay? Why Does Micron Require Particular Caution?
Micron is a classic high-volatility cyclical stock. It is simultaneously affected by DRAM prices, NAND prices, HBM orders, customer qualifications, earnings, capital expenditures, and competitor supply.
Suppose MU experiences a sequence such as +8%, -7%, +6%, -9%. Even if the price has not moved much over the period, MUU’s net asset value after daily amplification and resetting may still decline meaningfully.
Direxion warns that the longer the holding period and the higher MU’s volatility, the more pronounced the compounding bias becomes. MUU may even lose money while MU posts a multi-day cumulative gain.
For XMUU, the risk structure can be summarized as:
Single-stock high volatility × Daily 2× × On-chain market deviation
7. Can XMUU Be Liquidated? Why Can You Still Lose Heavily Without a Liquidation Price?
The MUU ETF has no personal margin account for users, so it generally does not have perpetual-futures-style funding rates, margin calls, or personal liquidation prices.
But the absence of a traditional liquidation line does not mean losses are limited. If MU falls 20% in one day, MUU’s target change may be close to -40%. After a large decline, even if MU rebounds, MUU must recover from a smaller principal base.
For example, after $100 falls 40%, only $60 remains. To get back to $100, it must rise 66.7%, not 40%. This is why leveraged drawdowns are so difficult to repair.
XMUU’s specific risk handling, trading halts, price protection, and extreme-market rules should be based on HIBT product documents and cannot be directly copied from U.S. ETF rules.
8. Why Has Micron Become an Important Profit Engine in the AI Era?
The bottleneck in AI systems is not only compute chips. As model parameters, context, training data, and inference tokens continue to grow, GPUs must rapidly read and write enormous amounts of data. Memory bandwidth and capacity directly affect compute efficiency.
The demand transmission can be summarized as:
Larger AI models → More GPU clusters → Higher HBM capacity and bandwidth → More server DDR → SSD storage expansion → Higher memory value
HBM has more complex stacking, packaging, yield, and qualification requirements, and its value per unit is significantly higher than ordinary DRAM. AI data centers also drive DDR5 RDIMMs, LPDRAM, and high-performance SSDs, so Micron benefits beyond HBM alone.
9. What Does $41.456 Billion in Q3 Revenue Mean?
The Micron FY2026 Q3 official earnings release shows:
- Revenue: $41.456 billion, versus $23.860 billion last quarter and $9.301 billion a year earlier;
- GAAP gross margin: 84.6%, versus 37.7% a year earlier;
- GAAP operating income: $33.318 billion;
- GAAP net income: $28.243 billion;
- GAAP diluted EPS: $24.67;
- Operating cash flow: $25.39 billion;
- Adjusted free cash flow: $18.3 billion;
- Net capital expenditures: $7.1 billion.
Revenue grew about 346% year over year, but you should not interpret all of that growth as higher unit shipments. The enormous profit elasticity of memory companies usually comes from changes in volume, average selling price, product mix, and manufacturing cost together.
10. Why Did Micron’s Gross Margin Rise From 37.7% to 84.6%?
The Micron Q3 10-Q shows that higher average selling prices, improved mix, and lower manufacturing costs combined to drive gross margin, with price increases being an important factor.
Memory production has high fixed costs and highly volatile product prices. Fab depreciation and personnel costs do not move in sync with selling prices, so when ASP rises, a large portion of incremental revenue converts into profit; when ASP falls, profit can also contract quickly.
An 84.6% gross margin shows that Micron has an extremely strong pricing environment, but it is also an important cycle warning: the current earnings base is already very high. Even if revenue continues to grow, margin may peak if ASP growth slows or costs rise.
Investors should gradually shift from “how fast is profit growing?” to “how long can peak earnings last?”
11. Why Is HBM4 an Important Catalyst for Micron?
Micron disclosed that HBM4 based on 1-beta DRAM has entered high-volume shipments for major customer platforms and is providing qualification samples to multiple end customers; HBM4E based on 1-gamma DRAM is expected to enter mass production in 2027.
This means HBM4 is no longer just a future roadmap item; it has entered actual supply and customer qualification.
Key things to watch going forward:
- Demand from NVIDIA and AMD’s next-generation AI platforms;
- Number of Micron HBM4 customers;
- Speed from qualification to mass production;
- HBM yield and packaging capability;
- Price per unit of capacity;
- HBM market share;
- HBM4E mass-production cadence.
Product shipment does not equal stable share. Samsung and SK hynix will also expand capacity and improve their technological competitiveness.
12. Can Micron Expand HBM Share Against SK hynix and Samsung?
When the AI Memory market grows fast enough, Micron does not necessarily need to capture a large amount of share to keep growing. But once industry supply gradually catches up with demand, customer qualification, yield, power consumption, capacity, and price will determine share.
To judge competitiveness, do not just look at “has launched HBM4.” Look at:
- HBM shipment volume and revenue mix;
- Qualification on major AI accelerator platforms;
- Yield and delivery stability;
- HBM4 and HBM4E power consumption;
- Whether the customer structure is overly concentrated;
- Advanced packaging capacity;
- Competitor capacity expansion speed.
Market expansion and share gains can happen at the same time. Whether Micron’s growth can continue to beat expectations ultimately depends on whether total demand growth exceeds the supply growth of the three major players.
13. Why Is Data Center More Important to Watch Than PC and Smartphones?
In FY2026 Q3, Cloud Memory revenue was $13.769 billion, up sharply from $7.749 billion last quarter; Core Data Center revenue was $11.524 billion, versus only $1.530 billion a year earlier.
Together, these two have become important sources of Micron’s growth. The Data Center business benefits not only from HBM, but also from server DRAM, low-power memory, and enterprise SSDs.
However, investors still need to distinguish between the product and customer definitions of Cloud Memory and Core Data Center and cannot call all revenue HBM. What really matters is whether AI-related demand continues to translate into shipments, ASP, margin, and cash flow.
14. Will Strategic Customer Agreements Change the Memory Cycle?
Micron disclosed that it has signed multiple multi-year Strategic Customer Agreements containing specific product volume commitments, customer deposits, and related financial commitments. Management believes these agreements can improve the durability and predictability of financial performance.
Public investor materials show that 14 of 16 SCAs have about $100 billion in remaining cumulative revenue at contractual minimum prices; the agreements cover DRAM, HBM, and NAND and may include volume commitments and price bands or floor mechanisms.
Their significance is to partially transform the traditional model:
Demand forecast → Manufacturer capacity expansion → Sharp price swings
into:
Customer commitments → Capacity planning → Price floors → Higher revenue visibility
But $100 billion is not current revenue, nor is it an unconditional backlog. Revenue still depends on contract duration, product delivery, customer credit, price terms, and accounting recognition.
SCAs may reduce cycle amplitude, but they cannot eliminate industry supply and demand. If industry prices fall sharply, long-term contracts may also lead to renegotiation, customer concentration, or opportunity-cost issues.
15. Why Are $22 Billion in Customer Funding Commitments Important?
Micron’s 10-Q discloses that signed SCAs are expected to bring $22 billion in cash deposits and related financial commitments, of which about $18 billion are cash deposits.
The fact that customers are willing to provide funds in advance shows that memory supply is strategically valuable to their data center plans and can also help Micron fund capacity expansion.
But that $22 billion cannot be directly counted as revenue or profit. When analyzing it, continue to check:
- Timing of deposit payments;
- Refund terms;
- Contract duration;
- Cancellation and default clauses;
- Price floors and ceilings;
- Product mix;
- How deposits are recorded on the balance sheet.
It is evidence of demand commitments and financing support, not earned revenue.
16. What Does Q4 Guidance of $50 Billion Revenue and 86% Gross Margin Mean?
Micron expects FY2026 fourth-quarter revenue of $50 billion, plus or minus $1 billion; both GAAP and non-GAAP gross margin of about 86%; and non-GAAP EPS of about $31, plus or minus $1.
This guidance shows that memory supply and demand remain very tight, and product prices and mix may continue to improve in Q4.
But when gross margin approaches 86%, investors should not only ask “how much more can it grow next quarter?” They should also ask:
- Is the current level close to peak cycle profit?
- Are customers pulling forward purchases?
- When will competitors’ new capacity be released?
- Can HBM and conventional DRAM prices hold?
- Is the FY2027 comparison base too high?
The market often trades a cycle-peak expectation before earnings confirm peak earnings.
17. When Will Memory Price Increases End?
The core of the Memory Cycle remains supply and demand.
Demand includes AI servers, cloud computing, PCs, smartphones, autos, and edge devices. Supply includes capital expenditures, process upgrades, yields, and wafer capacity from Micron, Samsung, and SK hynix.
Investors should continue to track:
- DRAM spot and contract prices;
- NAND prices;
- HBM contract prices;
- Manufacturer inventory days;
- Customer inventory;
- Bit shipment and bit supply growth;
- Fab utilization;
- CapEx from the three major manufacturers.
When supply growth persistently exceeds demand growth, ASP will eventually fall. AI can raise the demand baseline, but it cannot make the laws of manufacturing supply and demand disappear.
18. Will Large-Scale Capacity Expansion Create the Next Oversupply?
Micron plans to invest more than $250 billion in the United States over the long term and increase the share of U.S. DRAM production. The company also expects future capital expenditures to continue rising to meet AI-driven memory demand.
This is a classic double-edged sword.
The bull case argues that long-term contracts, customer deposits, and AI demand can support new capacity, while advanced nodes and HBM can increase value density.
The bear case argues that ultra-high profits will stimulate industry-wide capacity expansion. CapEx invested today becomes capacity several years from now, and if demand growth slows by then, oversupply will pressure ASP and margin.
Today’s CapEx is both tomorrow’s capacity and the day-after-tomorrow’s cycle risk.
19. Why Did MUU Soar Over a Year but Still Fall Nearly 30% in Three Months?
As of August 31, 2026, Direxion official data showed MUU’s NAV year-to-date return was about 516.22%, one-year return was about 2,898.92%, but three-month return was -28.64%.
This data is more educational than an abstract risk warning: high long-term returns and large interim drawdowns can exist at the same time.
A nearly 29x one-year gain does not automatically make the next buy safer. On the contrary, the larger the past gain, the higher the market’s expectations for future demand, prices, and profits. Once results are merely “very good but no longer beating expectations,” valuation and leverage can amplify the drawdown together.
20. What Does MUU’s 20-for-1 Stock Split Mean?
The Direxion stock split announcement shows that MUU implemented a 20-for-1 forward split in July 2026 and began trading at post-split prices on July 15.
Assume you held 1 share at $600 before the split. After the split, you would theoretically hold 20 shares at $30 each, with total value still $600.
A split does not create returns, does not change the daily 2x target, and does not reduce volatility risk. It only changes the number of shares and the price per share. When viewing historical candlesticks, you must use adjusted data; otherwise, it is easy to mistake the price gap for a 95% crash.
21. Does MUU’s 1.01% Expense Ratio Matter?
For one- or two-day trades, the annual expense ratio has a relatively limited impact. But as the holding period lengthens, management fees, swap financing, trading costs, and tracking error all accumulate.
MUU’s net expense ratio is about 1.01%, and official notes show that excluding acquired fund fees and expenses, the net expense ratio is about 0.92%; items such as swap financing and related costs may also be excluded from the expense cap.
Therefore, actual returns should be understood as:
Leveraged result of MU’s daily path − fund fees − financing and trading frictions − XMUU market deviation
22. What Market Environment Suits XMUU Best?
MU Rises Persistently With Low Volatility
This is the most favorable environment. Consecutive gains may create positive compounding, allowing MUU’s multi-day return to match or slightly exceed a simple 2x.
MU Rises but Swings Violently Every Day
Your direction may be right, but MUU’s return may fall short of expectations because of repeated volatility.
MU Chops at High Levels
This is the classic environment for volatility decay. MU may end up little changed, while MUU’s NAV still declines.
MU Falls Persistently
Daily 2x quickly amplifies losses, and the difficulty of recovering increases as NAV falls.
MU V-Shaped Rebound After a Crash
MU returning to its original price does not mean MUU recovers in sync, because returns are calculated on a new NAV base every day.
23. Is XMUU Suitable for Long-Term Holding of a Micron Supercycle?
You cannot answer this only with “AI will need more memory over the long term.”
Before using XMUU long term, you must at least confirm two judgments: first, Micron’s fundamentals are improving long term; second, MU’s upward path is relatively persistent rather than frequently and sharply choppy.
Direxion explicitly states that leveraged ETFs seek daily objectives, should not be expected to track a fixed multiple of the underlying security over the long term, and are more suitable for investors who understand leverage and actively manage positions.
If the goal is to hold for three to five years waiting for structural growth in the memory industry, directly researching MU and using daily 2x MUU/XMUU are completely different strategies. The latter is not an automatic upgrade of the former.
24. Why Can’t XMUU Price Prediction Simply Multiply the MU Target Price by Two?
Users can refer to XMUU price prediction to observe trends, but the following model is wrong:
MU rises from $300 to $400, up 33% → XMUU must rise 66%
The actual result also depends on:
- Daily price path;
- MU volatility;
- MUU fees and financing costs;
- ETF tracking error;
- MUU market price versus NAV;
- XMUU premium/discount versus MUU;
- USDT versus USD price deviation.
A more reasonable approach is path-based scenario simulation: set direction, volatility, holding period, and product deviation separately, then calculate a range of outcomes.
25. XMUU’s Bull, Base, and Bear Scenarios
Bull Case: Supercycle Continues and MU Rises Steadily
The optimistic scenario requires HBM4 demand to remain strong, AI data center CapEx to keep growing, DRAM and NAND prices to stay high, SCAs to be fulfilled smoothly, Q4 and FY2027 results to continue beating expectations, and Micron to expand HBM share.
For XMUU, an additional condition is needed: MU must rise in a relatively stable, low-volatility trend so that daily 2x produces positive compounding.
Base Case: Earnings Stay High, but Growth Gradually Slows
The neutral scenario is that AI demand remains strong, memory prices stop rising quickly, Micron’s earnings remain high, but the market begins to trade peak earnings. MU may generally move higher, but with greater volatility.
In this case, XMUU’s multi-day return may be significantly lower than “MU cumulative return times two.”
Bear Case: Memory Prices Peak and Enter a Downcycle
The pessimistic scenario includes increased HBM supply, persistently falling DRAM ASP, capacity expansion by Samsung and SK hynix, slower AI CapEx, rising customer inventory, delayed SCA purchases, and valuation compression.
If MU falls while volatility rises, XMUU will suffer from directional losses, daily leverage, and path erosion at the same time.
26. When Should You Admit the XMUU Bull Thesis Has Failed?
Define observable signals in advance:
- HBM demand or shipment guidance is cut;
- DRAM ASP declines sequentially for multiple periods;
- Cloud Memory and Core Data Center revenue weakens sequentially;
- SCA customers delay purchases or renegotiate;
- Manufacturer or customer inventory rises rapidly;
- Micron’s gross margin remains below guidance;
- FY2027 revenue and EPS expectations are repeatedly lowered;
- CapEx rises while free cash flow deteriorates significantly;
- HBM4 customer qualification or mass production disappoints;
- MU’s trend weakens and volatility continues to rise;
- XMUU liquidity falls and it diverges from MUU for a prolonged period.
“AI will need memory over the long term” cannot explain away all short- and medium-term deterioration.
27. What Is the Difference Between XMUU and XINTW?
What Is XINTW/USDT ultimately bets on an Intel turnaround, with core variables being 18A, CPUs, DCAI, external foundry customers, and manufacturing losses.
XMUU ultimately bets on Micron, with core variables being HBM, DRAM, NAND, ASP, and the Memory Cycle.
Both share single-stock and daily 2x exposure, but Intel is more about technology and execution turnaround, while Micron is more about AI demand, supply discipline, and commodity price cycles.
28. What Is the Supply-Chain Relationship Between XMUU and DELL?
What Is DELL/USDT discusses AI server orders, deliveries, margins, and cash flow. Dell servers require GPUs, CPUs, HBM, DDR, and SSDs, while Micron supplies some of the memory and storage products.
Dell AI server orders can serve as a reference variable for data center hardware demand, but they cannot simply be used to conclude that Micron must rise. Dell may use different suppliers, and procurement prices, inventory, and product mix also affect transmission.
29. What AI Bottlenecks Do XMUU and XBE Respectively Bet On?
What Is XBE/USDT is more focused on AI data center power and the Bloom Energy power-supply logic; XMUU bets on memory bandwidth, capacity, and storage demand.
AI infrastructure includes at least compute, memory, servers, networking, storage, and power. Holding multiple related assets does not necessarily achieve sufficient diversification, because they may be affected simultaneously by AI CapEx and tech-stock risk-off.
30. Why Can BTC and ETH Still Affect XMUU?
XMUU’s long-term value anchor comes from Micron, MU, and MUU. BTC does not directly improve HBM4 yields or determine DRAM prices.
But in the crypto market, BTC price prediction reflects a risk cycle that may affect USDT liquidity, trader activity, order-book depth, and XMUU’s short-term premium. BTC is a trading-environment variable, not a Micron fundamental variable.
Likewise, ETH price prediction is better used as a reference for RWA, tokenized ETF, and on-chain financial conditions. XMUU runs on Solana, and changes in ETH prices do not mean MU profits will change in sync.
31. Why Can XMUU’s Price Temporarily Diverge From MUU?
XMUU trades on HIBT in USDT, while MUU trades in U.S. securities markets in USD. The two may temporarily diverge because of:
- Different U.S. stock market hours and crypto market hours;
- HIBT order-book depth;
- XMUU market-making and arbitrage efficiency;
- Solana deposit or withdrawal status;
- Sudden Micron, NVIDIA, or memory news;
- Short-term USDT deviation from USD;
- Product issuance and redemption mechanisms.
You can build an XMUU Premium Tracker:
Premium/discount rate = (XMUU price − MUU reference price for the same period) ÷ MUU reference price for the same period × 100%
As of September 11, 2026, Direxion’s official page showed MUU NAV and market close both at $31.43; near the U.S. market close on September 14, market tools showed MU at about $924.03 and MUU at about $28.14. The two timestamps cannot be mixed in the same formula.
32. HIBT XMUU 8-Factor Investment Framework
Factor 1: HBM Demand
Is demand for HBM capacity, bandwidth, and shipments from AI accelerators and servers still growing?
Factor 2: DRAM/NAND Pricing
Are memory prices still rising, peaking, or already falling?
Factor 3: Data Center Revenue
Are Cloud Memory and Core Data Center growth continuing?
Factor 4: SCA Coverage
Can multi-year agreements truly improve demand visibility and price stability?
Factor 5: MU Earnings
Are revenue, gross margin, EPS, and free cash flow growing together?
Factor 6: MU Valuation
How much expectation has the market already priced in for the memory supercycle?
Factor 7: MU Volatility
Is volatility high enough to erode daily 2x multi-day returns?
Factor 8: XMUU Market Risk
Are the issuance structure, Solana contract, liquidity, premium/discount, and trading rules clear?
The four most critical are memory pricing, HBM demand, MU volatility, and valuation. The final conclusion should be classified as favorable, neutral, or unfavorable, rather than simply shouting “worth buying.”
33. XMUU’s 12 Biggest Risks
- Daily 2x Risk: both daily gains and losses are amplified.
- Volatility Decay: high volatility can erode multi-day compounding.
- Path Dependency: the same endpoint can produce different returns.
- Single-Stock Risk: risk is concentrated in one company, Micron.
- Memory Cycle Risk: DRAM and NAND prices may reverse.
- HBM Competition Risk: SK hynix and Samsung continue to compete.
- Supply Expansion Risk: high CapEx may ultimately create oversupply.
- Peak Margin Risk: current ultra-high gross margin may not last.
- AI CapEx Risk: lower hyperscaler investment would weaken demand.
- Valuation Risk: MU’s stock price may already price in too much supercycle optimism.
- XMUU Product Risk: disclosure on underlying support, custody, and redemption structure is limited.
- Liquidity/Premium Risk: HIBT XMUU order-book depth is not the same as U.S. MUU market depth.
34. Check These 14 Items Before Trading XMUU
- MU’s latest price and trend;
- MUU’s latest market price and NAV;
- XMUU’s live price;
- XMUU’s premium or discount versus MUU;
- MU’s recent volatility;
- DRAM spot and contract prices;
- NAND prices;
- HBM demand and customer qualification;
- Cloud Memory and Core Data Center revenue;
- Micron’s gross margin;
- Operating cash flow and adjusted free cash flow;
- SCA fulfillment and changes in customer deposits;
- Micron and competitor CapEx;
- XMUU contract, liquidity, estimated slippage, and withdrawal status.
Price should be checked after asset identity, fundamentals, and exit capability. A low unit price does not mean cheap valuation, and a large past gain does not mean the future is safer.
35. What Investment Strategies Suit XMUU?
Earnings and Product Catalyst Strategy
Watch Micron earnings, Q4 guidance, HBM4 customer qualification, HBM4E progress, DRAM prices, and NVIDIA platform launches. Volatility around events can be extreme, and you should avoid using the long-term AI story to justify short-term losses.
Trend Confirmation Strategy
MUU is better suited to phases when MU forms a clear, persistent trend. If there is one big up day followed by violent choppiness, you may get both drawdown and volatility drag.
Risk Budget Strategy
Position size should be derived backward from maximum allowable loss. If a single strategy in your account can lose at most 1%, you must calculate position size using XMUU’s potential double-digit single-day moves, not just the target return.
Short-Cycle Review Strategy
Before entering, write down the catalyst, planned holding period, price-path assumptions, exit conditions, and signals that invalidate the bull thesis. Daily leveraged products require more frequent review than ordinary stocks.
36. XMUU FAQ
What is XMUU?
XMUU is an on-chain asset tied to MUU listed by HIBT on Solana, ultimately corresponding to daily 2x ETF price exposure to Micron.
What is XMUU/USDT?
It is the XMUU trading market quoted in USDT, not a cryptocurrency officially issued by Micron.
What ETF is MUU?
MUU is the Direxion Daily MU Bull 2X ETF, seeking 200% of the daily performance of Micron common stock, MU.
What is the relationship between MUU and Micron stock?
MUU uses derivatives to obtain roughly 2x daily exposure to MU. Investing in MUU is not the same as directly holding two shares of MU.
Is XMUU Micron stock?
No. XMUU provides price exposure related to MUU and does not represent directly registered ownership of MU shares on NASDAQ.
Is MUU really 2x Micron?
Its target is 2x daily. Beyond one trading day, the result is affected by compounding, volatility, fees, and tracking error.
Why doesn’t MUU equal MU’s gain times two over the long term?
Because leverage resets daily, and each day is calculated on a new NAV base. The sequence of gains and losses changes the final return.
Can MUU be liquidated?
It generally does not have a perpetual-futures-style personal liquidation price, but extreme single-day declines can still cause devastating losses.
Is MUU suitable for long-term investing?
Direxion positions leveraged ETFs as tools for investors who understand leverage and actively manage positions. You should not expect them to provide a fixed 2x return on MU over the long term.
Why did MUU rise so much in 2026?
Micron’s revenue, ASP, HBM demand, and margins grew sharply. MU’s rise was then amplified by daily 2x, driving extreme interim returns in MUU.
Why does Micron benefit from AI?
AI training and inference require large amounts of high-bandwidth memory, server DRAM, and data center SSDs. Memory is becoming a key bottleneck in computing systems.
Why is HBM4 important?
HBM4 provides higher bandwidth and capacity and has entered high-volume shipments on Micron’s major customer platforms. It is an important companion product for next-generation AI accelerators.
Why is Micron’s gross margin so high?
It is mainly driven by higher memory ASP, improved product mix, and lower manufacturing costs. Ultra-high gross margin also means investors must watch for future price and cycle peaks.
What are Micron’s Strategic Customer Agreements?
They are agreements containing multi-year product volume commitments, customer deposits, and related financial arrangements, intended to improve demand and price visibility, but they are not already recognized revenue.
How long can the memory supercycle last?
It depends on AI demand, HBM qualification, DRAM/NAND prices, inventory, CapEx from the three major manufacturers, and new capacity. Fixed-year forecasts have limited reliability.
What does MUU’s 20-for-1 split mean?
Each 1 share theoretically becomes 20 shares, the per-share price falls to about one-twentieth, and total investment value is basically unchanged. It does not represent a price crash.
What should XMUU price prediction look at?
It should analyze HBM demand, memory prices, Micron earnings, MU trend and volatility, MUU daily compounding, and XMUU premium/discount together.
37. Conclusion: XMUU Bets on Both the Supercycle and the Path Higher
Micron has entered an extremely strong profitability cycle in 2026. Q3 revenue reached $41.456 billion, GAAP gross margin was 84.6%, and operating cash flow was $25.39 billion; Q4 guidance points to $50 billion in revenue and about 86% gross margin. HBM4 has entered high-volume shipments, and multi-year SCAs and customer deposits have improved future demand visibility.
But extremely strong conditions are themselves a source of risk. Rising memory prices will encourage Micron, Samsung, and SK hynix to increase capital expenditures. The CapEx added today will eventually become future supply, and once supply growth exceeds demand, ASP, margin, and earnings may fall quickly.
Ordinary MU investors mainly judge Micron’s fundamentals and valuation. XMUU investors must also judge whether MU’s upward path is stable enough.
AI investment → HBM/DRAM/NAND demand → Memory prices → Micron revenue and profit → MU share price path → MUU daily compounding → XMUU premium/discount → Actual investment return
So the core of XMUU investing is not simply judging whether “AI will continue to need more memory,” but judging how long the super-boom can last, when memory prices will peak, and whether MU’s rise will include violent swings severe enough to break daily 2x compounding.
Being right on direction is only step one. For XMUU, direction, volatility, path, and wrapper risk together determine the final return.